Integrating Jaeger (with Otel) and Fast API Tracing
Repo link
Section titled “Repo link”Tracing FastAPI with OpenTelemetry and Jaeger on Kubernetes
Section titled “Tracing FastAPI with OpenTelemetry and Jaeger on Kubernetes”Distributed systems are hard to debug. A single user request often spans multiple services, databases, and third-party APIs. Logs alone rarely capture the full picture. That’s where tracing comes in. In this post, we’ll walk through integrating FastAPI, OpenTelemetry (OTel), and Jaeger for end-to-end observability, and how to deploy it all on Kubernetes.
Why Tracing?
Section titled “Why Tracing?”- Correlate requests across microservices.
- Measure latency at each hop.
- Pinpoint failures with span-level detail.
- Visualize call graphs inside Jaeger.
Components
Section titled “Components”- FastAPI – The backend service we want to trace.
- OpenTelemetry SDK – Captures and exports trace data.
- Collector – Optional pipeline to buffer, process, and forward traces.
- Jaeger – UI for searching and visualizing traces.
Fast API
Section titled “Fast API”# This is just the snippet, you can find the full file hereimport osimport loggingimport randomimport timefrom fastapi import FastAPIfrom opentelemetry import tracefrom opentelemetry.sdk.trace import TracerProviderfrom opentelemetry.sdk.resources import Resourcefrom opentelemetry.sdk.trace.sampling import ParentBased, TraceIdRatioBasedfrom opentelemetry.sdk.trace.export import BatchSpanProcessorfrom opentelemetry.exporter.otlp.proto.grpc.trace_exporter import OTLPSpanExporterfrom opentelemetry.instrumentation.fastapi import FastAPIInstrumentorfrom opentelemetry.instrumentation.requests import RequestsInstrumentorapp = FastAPI()# Configure service name and sampling rate via environment variablesSERVICE_NAME = os.getenv("OTEL_SERVICE_NAME", "fastapi-backend")SAMPLE_RATIO = float(os.getenv("OTEL_SAMPLING_RATIO", "1.0"))OTEL_EXPORTER_ENDPOINT = os.getenv("OTEL_EXPORTER_OTLP_ENDPOINT", "http://otel-collector:4317")# Tracer provider setupresource = Resource.create({"service.name": SERVICE_NAME})provider = TracerProvider( resource=resource, sampler=ParentBased(TraceIdRatioBased(SAMPLE_RATIO)),)processor = BatchSpanProcessor( OTLPSpanExporter(endpoint=OTEL_EXPORTER_ENDPOINT, insecure=True))provider.add_span_processor(processor)trace.set_tracer_provider(provider)# Instrument FastAPI and RequestsFastAPIInstrumentor.instrument_app(app)RequestsInstrumentor().instrument()@app.get("/hello")def hello(): time.sleep(random.uniform(0.1, 0.5)) return {"msg": "hello traced world"}Deploying Jaeger and the OTel Collector
Section titled “Deploying Jaeger and the OTel Collector”Option 1 – Direct Export
Section titled “Option 1 – Direct Export”FastAPI exports directly to Jaeger. Simple, but harder to scale.
Option 2 – Collector Fan-out
Section titled “Option 2 – Collector Fan-out”FastAPI exports to the OTel Collector, which can fan out to Jaeger, Prometheus, or a SaaS APM. Recommended for production.
Kubernetes deployment with Helm or manifests:
Section titled “Kubernetes deployment with Helm or manifests:”Visualizing Traces
Section titled “Visualizing Traces”Once running, open Jaeger’s UI (default at http://localhost:16686) and search for your service name (fastapi-backend). You’ll see:
- Trace timelines per request.
- Span breakdowns with latency.
- Call graphs across services.
Sample Dash
Section titled “Sample Dash”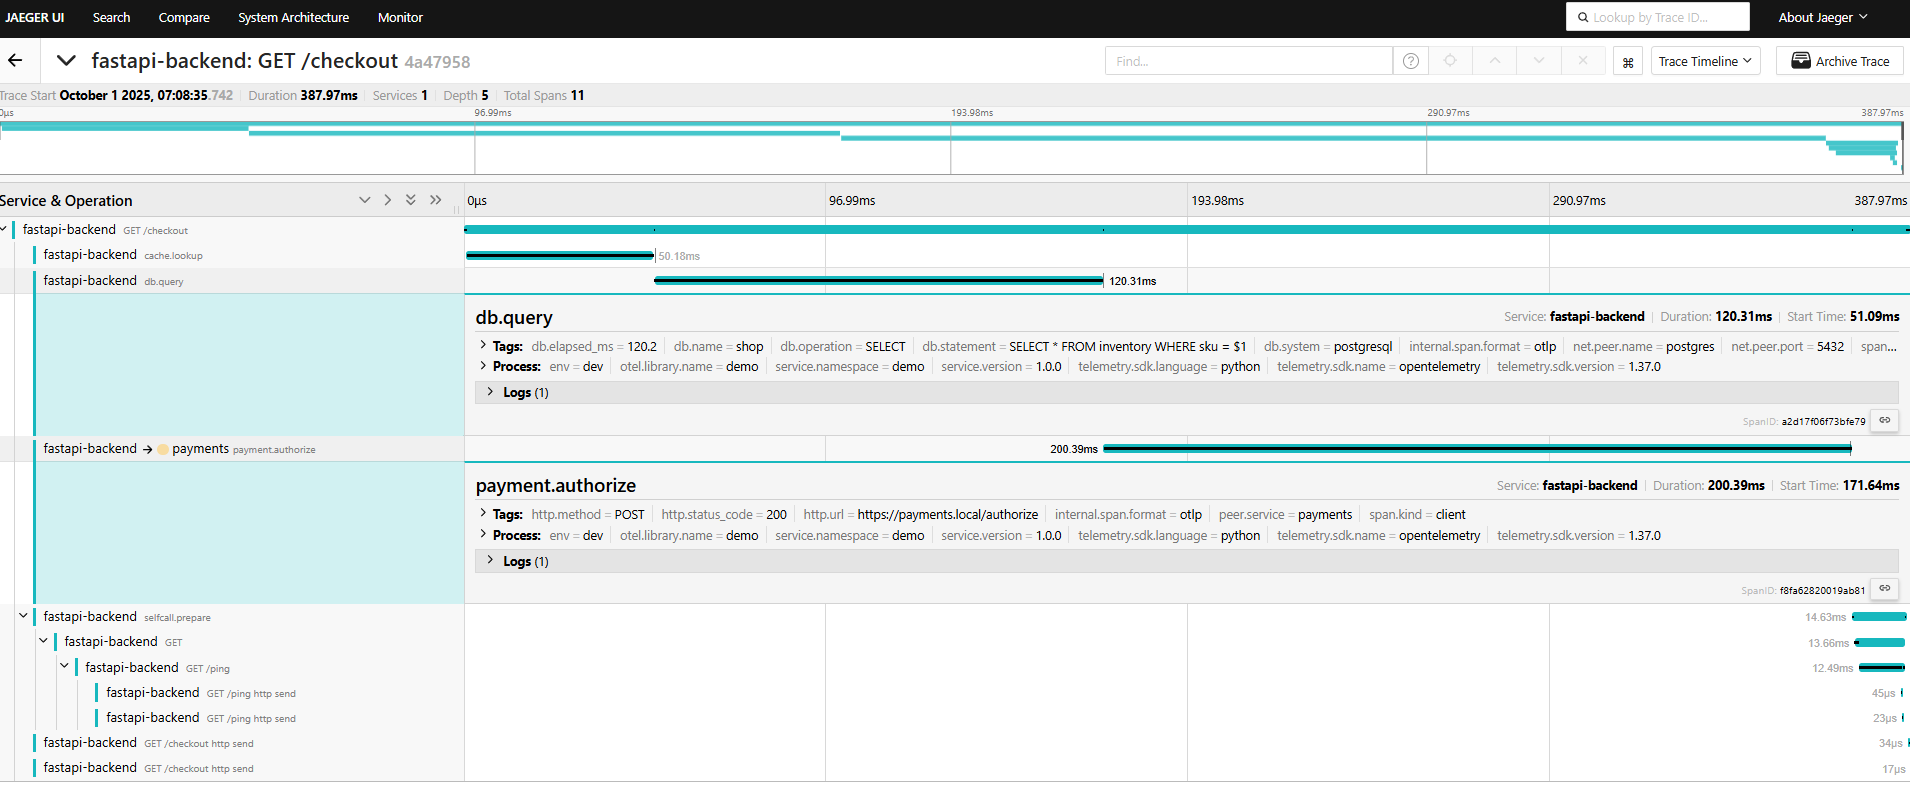
- Note here that the call to the dummy “payment” service is tracked, we can add different events, and errors as needed
- I also added a call to another endpoint on the same fast-api just to check whether it can fully continue the trace ID, in the
/pingend point note that i did not put any span tracer, but it got recorded too
Key Takeaways
Section titled “Key Takeaways”- Use OTel SDK inside FastAPI for instrumentation.
- Export traces either directly or through a Collector.
- Collector fan-out gives flexibility to send traces to Jaeger, Prometheus, or cloud APMs.
- Jaeger provides the UI to analyze traces and speed up debugging.
- No ned to use Perfcounter to count how long a function takes, it is automatically calculated for each of the spans
Next Steps
Section titled “Next Steps”- Add logging and metrics via OTel for a complete observability stack.
- Integrate with Grafana Tempo or Elastic APM if Jaeger isn’t enough.
- Automate Kubernetes deployment with Helm charts.